PointCloudXplore: Visual Analysis of 3D Gene Expression Data Using Physical Views and Parallel Coordinates
O. Rubel, G.H. Weber, S.V.E. Keranen,
Charless Fowlkes, C.L. Hendriks, L. Simirenko, N.Y. Shah, M.B. Eisen, M.D. Biggin, H. Hagen, D. Sudar, J. Malik, D.W. Knowles, B. Hamann
To allow a more rigorous understanding of animal gene regulatory networks, the
Berkeley Drosophila Transcription Network Project (BDTNP) has developed a
suite of methods that support quantitative, computational analysis of
three-dimensional (3D) gene expression patterns with cellular resolution in
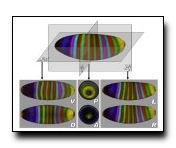
early Drosophila embryos. Here we report the first components of a
visualization tool, PointCloudXplore, that allows the relationships between
different gene's expression to be analyzed using the BDTNP's datasets.
PointCloudXplore uses the established visualization techniques of multiple
views, brushing, and linking to support the analysis of high-dimensional
datasets that describe many genes' expression. Each of the views in
PointCloudXplore shows a different gene expression data property. Brushing is
used to select and emphasize data associated with defined subsets of embryo
cells within a view. Linking is used to show in additional views the expression
data for a group of cells that have first been highlighted as a brush in a
single view, allowing further data subset properties to be determined. In
PointCloudXplore, physical views of the data are linked to parallel
coordinates. Physical views show the spatial relationships between different
genes' expression patterns within the embryo. Parallel coordinates, on the
other hand, show only some features of each gene's expression, but allow
simultaneous analysis of data for many more genes than would be possible in a
physical view. We have developed several extensions to standard parallel
coordinates to facilitate brushing the visualization of 3D gene expression
data.
Download: pdf
Text Reference
O. Rubel, G.H. Weber, S.V.E. Keranen, Charless C. Fowlkes, C.L. Luengo Hendriks, L. Simirenko, N.Y. Shah, M.B. Eisen, M.D. Biggin, H. Hagen, D. Sudar, J. Malik, D.W. Knowles, and B. Hamann.
Pointcloudxplore: visual analysis of 3d gene expression data using physical views and parallel coordinates.
In
Eurographics/IEEE VGTC Symposium on Visualization, 203–210. 2006.
URL:
http://www.eg.org/EG/DL/WS/VisSym/EuroVis06/203-210.pdf,
doi:10.2312/VisSym/EuroVis06/203-210.
BibTeX Reference
@inproceedings{Rubel_Eurovis_2006,
author = "Rubel, O. and Weber, G.H. and Keranen, S.V.E. and Fowlkes, Charless C. and Hendriks, C.L. Luengo and Simirenko, L. and Shah, N.Y. and Eisen, M.B. and Biggin, M.D. and Hagen, H. and Sudar, D. and Malik, J. and Knowles, D.W. and Hamann, B.",
title = "PointCloudXplore: Visual Analysis of 3D Gene Expression Data Using Physical Views and Parallel Coordinates",
booktitle = "Eurographics/IEEE VGTC Symposium on Visualization",
year = "2006",
pages = "203--210",
URL = "http://www.eg.org/EG/DL/WS/VisSym/EuroVis06/203-210.pdf",
DOI = "10.2312/VisSym/EuroVis06/203-210",
tag = "biological_images"
}